Where it leaks
Unbilled extras and new sites
Deep cleans, reactive call-outs and newly added sites are serviced, yet the invoice never moves to match, so the extra work is absorbed rather than charged.
Recurring charges that quietly stop
A regular monthly charge for a site or contract stops appearing in the ledger, often when a billing line is dropped during a site change, and the lost income goes unnoticed.
Failed Direct Debits on contract collections
A monthly Direct Debit for a service contract fails and is never re-presented or chased, so cleaning or treatment continues while the payment never arrives.
Missed consumables recharges
Paper, soap, bin liners and bait stations are supplied to sites but the recharge line is left off the invoice, so the cost is absorbed without the matching income.
Short payments left unrecovered
A client pays less than invoiced, deducting for a missed or disputed visit, and the shortfall is written off in the ledger rather than queried and collected.
Credit notes unapplied or duplicated
A credit note raised for a one-off complaint is left unapplied or issued twice, quietly reducing the value collected against invoices that were genuinely due.
The scale
Revenue leakage is commonly estimated at 1% to 3% of turnover, and GoCardless has observed that roughly 2.9% of Direct Debit payments fail across around 55,000 businesses. On a cleaning or pest control firm turning over £20m, 1% to 3% is roughly £200k to £600k a year, which is illustrative only but shows how quickly small per-site slips add up.
How it is found
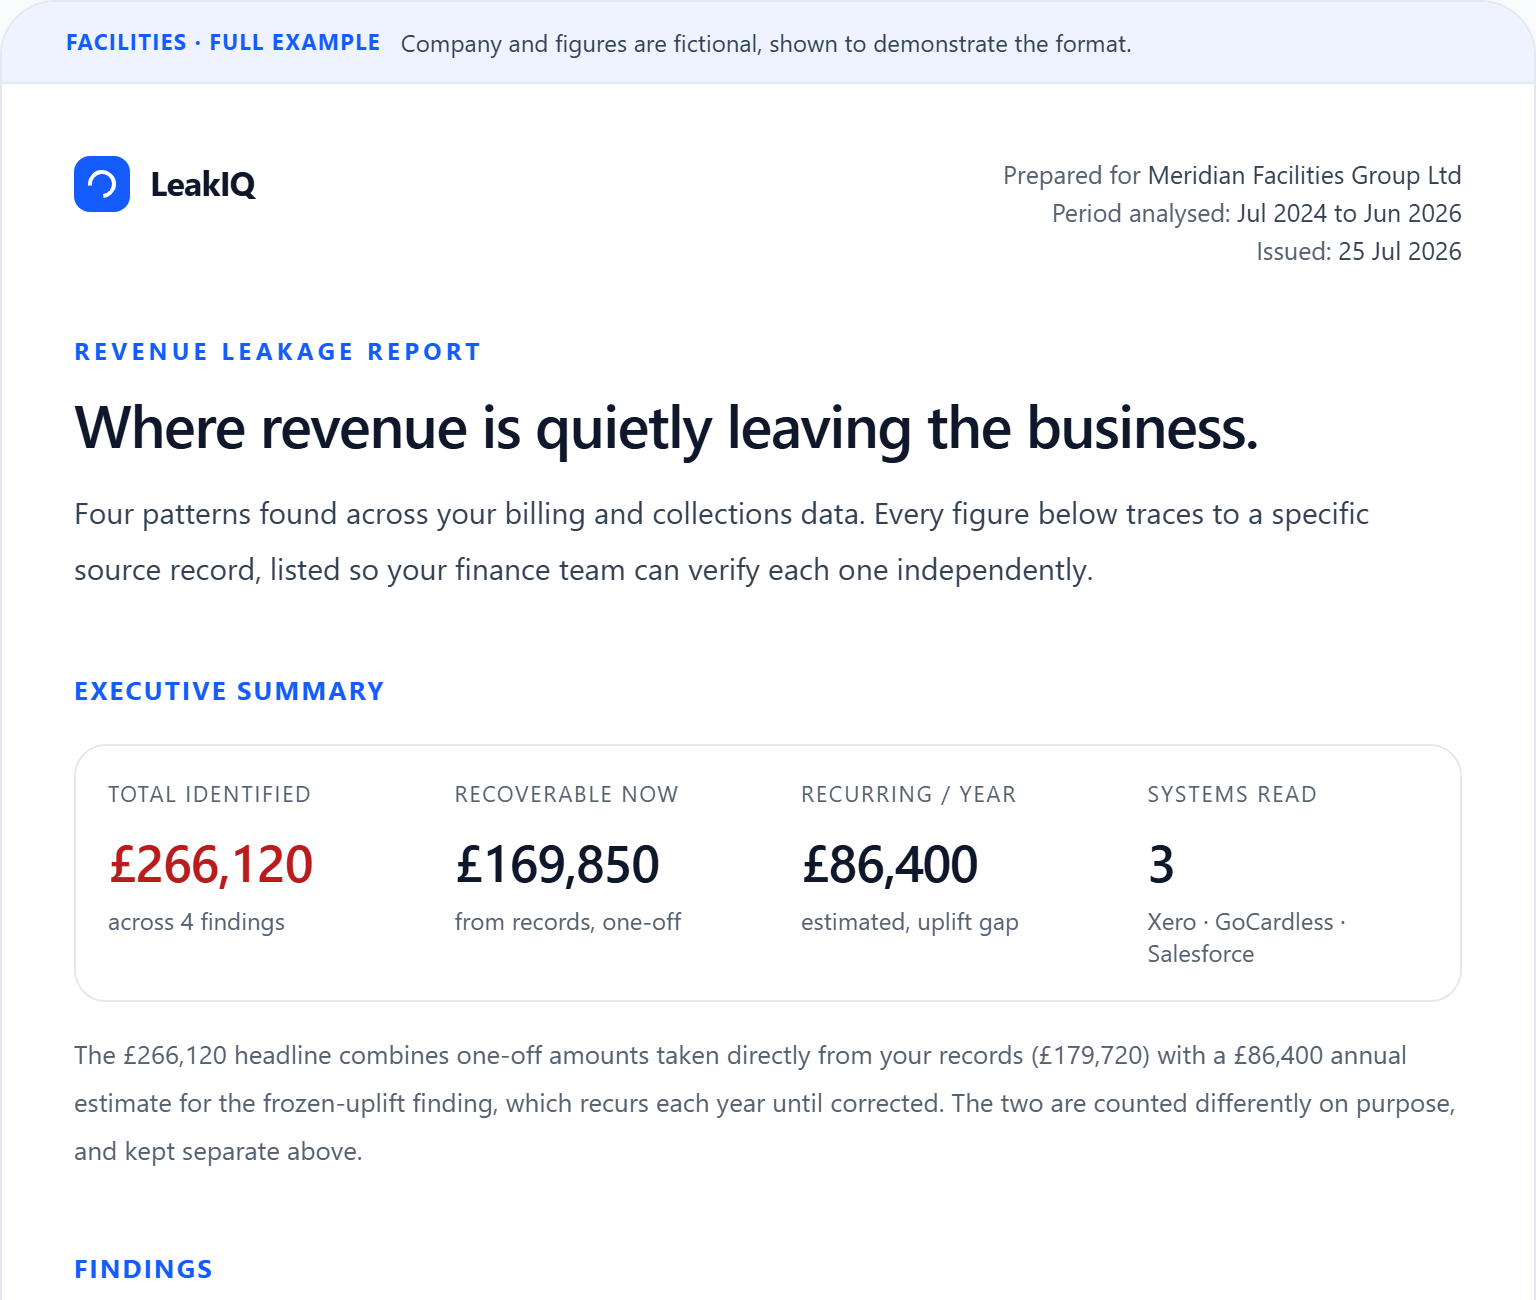
The figures come from reading your own invoices, payments and ledger data read-only, with no change to your billing or bank systems, and with no implementation to sit through first.
Take the full guide with you
If you would like your own number, we can produce a free read-only leakage report from your finance data, with no obligation to take it further.
Common questions
How can revenue leak if we invoice straight from our contracts?
Contracts in this sector change constantly: sites are added, extra visits and deep cleans are carried out, and consumables are supplied, but the invoice does not always keep up. Leakage is the gap between what was earned and what actually reached the bank, and it usually comes from many small errors rather than one large one.
Can this be found without changing our systems?
Yes. The analysis is read-only and works from a copy of your existing invoice, payment and ledger data, so nothing in your billing or bank setup changes. Because it is a read rather than an implementation, there is no rollout to sit through before the first findings appear.
What is a realistic amount to expect?
Revenue leakage is commonly estimated at 1% to 3% of turnover, though the real figure depends on how many sites and ad-hoc works you handle. That range is an industry estimate rather than our own measurement. One finance team found over £49,000 in their first month with us, which is a single example rather than a benchmark: your own number comes from your report.
How is this different from an aged debtors report or a Power BI or Tableau dashboard?
An aged debtors report, or a dashboard in Power BI or Tableau, shows what is already on your ledger: invoices you raised that have not been paid. Revenue leakage is the money that never reached the ledger correctly in the first place, under-billed, never invoiced, or failed on collection and never chased, so it usually never appears on a debtors report at all. That is what this audit looks for.
Keep reading
- What revenue leakage is
The plain definition, and why earned revenue slips before the bank.
- Revenue leakage in every other sector
The same field guide for facilities, waste, logistics, security and more.